Tutorial: Single Games
This tutorial shows how to simulate a single game and how to plot the results. First, we import the necessary modules. Then, we simulate one game between two teams without extra time and penalty shootout. The result is a 3:1 win for the home team.
from fussballgott import fussball, plot
import numpy as np

np.random.seed(1886)
home, away = fussball.simulate_game(
    AvGoalsF1=2,
    AvGoalsF2=1.5,
    AvGoalsA1=1.8,
    AvGoalsA2=1.2,
    include_goals_against=True,
)
print("Result of the game: {}:{}".format(home, away))
Result of the game: 3:1
Now we want to simulate the same game with extra time and penalty shootout. The result is a 5:3 win for the home team after extra time. The result after regular time is a 2:2 draw.
np.random.seed(2003)

home, away, when, home90, away90 = fussball.simulate_game(
    AvGoalsF1=2,
    AvGoalsF2=1.5,
    AvGoalsA1=1.8,
    AvGoalsA2=1.2,
    include_goals_against=True,
    extra_time=True,
    return_when=True,
)
print("Result of the game: {}:{} after {}".format(home, away, when))
print("Result after regular time: {}:{}".format(home90, away90))
Result of the game: 5:3 after AET
Result after regular time: 2:2
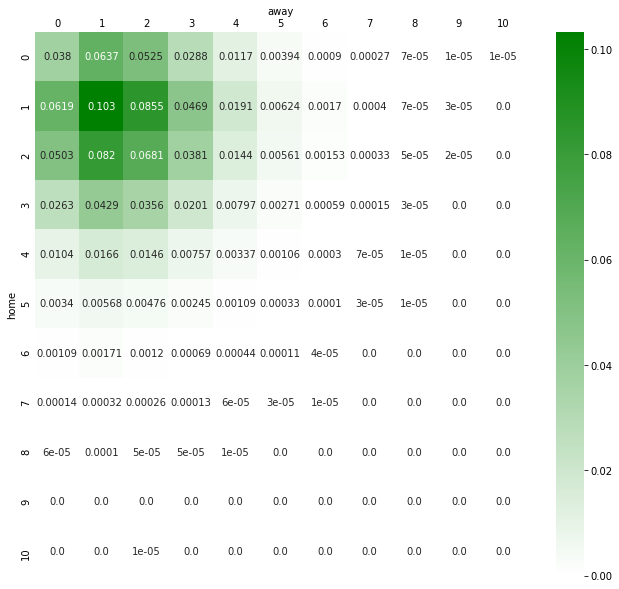
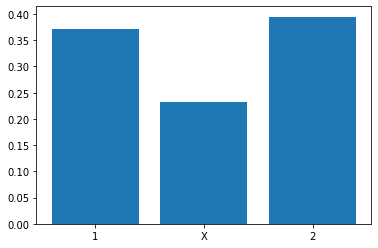
Finally, we do not only want to simulate a single game, but we want to know the
probability of a win, draw or loss for the home team. We can do this by simulating
many games and counting the results. The function simulate_game_stats does this
for us. It returns a table of results and the win probabilities.
stat, winprob = fussball.simulate_game_stats(
    AvGoalsF1=2,
    AvGoalsF2=1.5,
    AvGoalsA1=1.8,
    AvGoalsA2=1.2,
    include_goals_against=True,
)
plot.game_stat(stat, winprob)