Tutorial: League
In the following, we want to simulate a full league and a league from a given schedule. First, we import the necessary modules.
from fussballgott import load, league, plot, team
There are three ways how to simulate a league:
Full League simulation
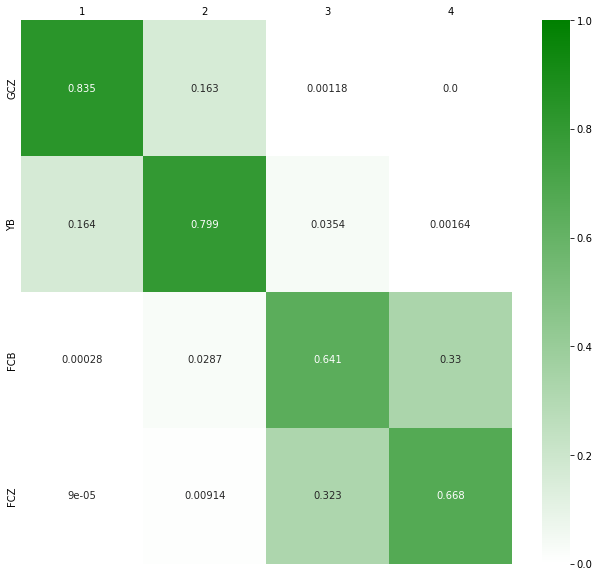
Here, we simulate a full league with 4 teams that play each other 4 times. We have to define the teams and their strength. The strength is defined by the average number of goals scored and conceded per game. After setting up the teams, we can simulate easily simulate the league by setting the number of simulations (n_sim=1e5) and the number of times each team plays each other (schedule=4).
teams = {}
teams["GCZ"] = team.Team(name="GCZ", GoalsF=3.1, GoalsA=0.9)
teams["YB"] = team.Team(name="FCB", GoalsF=2.3, GoalsA=1.7)
teams["FCB"] = team.Team(name="FCB", GoalsF=2, GoalsA=3.2)
teams["FCZ"] = team.Team(name="FCZ", GoalsF=1, GoalsA=4.3)

sim = league.simulate(teams, schedule=4, n_sim=1e5)

plot.league(sim)
League from schedule
Here, we simulate a league from a given schedule. In the schedule it is defined who plays against whom and how often. Games that are already played can be filled in the schedule. The schedule is a csv file with the following structure:
Home |
Away |
Goals Home |
Goals Away |
|---|---|---|---|
GCZ |
FCZ |
1 |
0 |
FCB |
YB |
0 |
2 |
GCZ |
YB |
3 |
1 |
FCZ |
FCB |
1 |
1 |
YB |
FCZ |
1 |
0 |
FCB |
GCZ |
1 |
4 |
GCZ |
FCB |
||
FCZ |
YB |
||
FCB |
FCZ |
||
YB |
GCZ |
||
YB |
FCB |
||
FCZ |
GCZ |
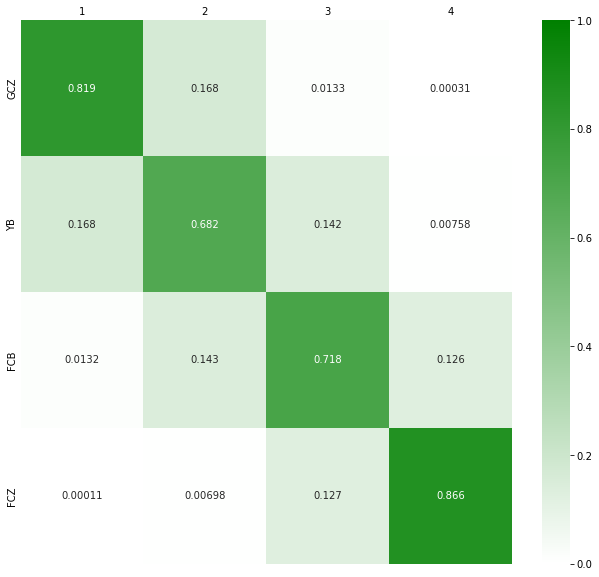
This file can then be loaded and the output of the load function can be used to simulate the league. This can also be plotted.
file = "league_schedule.CSV"
teams, schedule, table, missing_games = load.league(file)
sim = league.simulate(teams, schedule, table, missing_games, n_sim=1e5)
plot.league(sim)
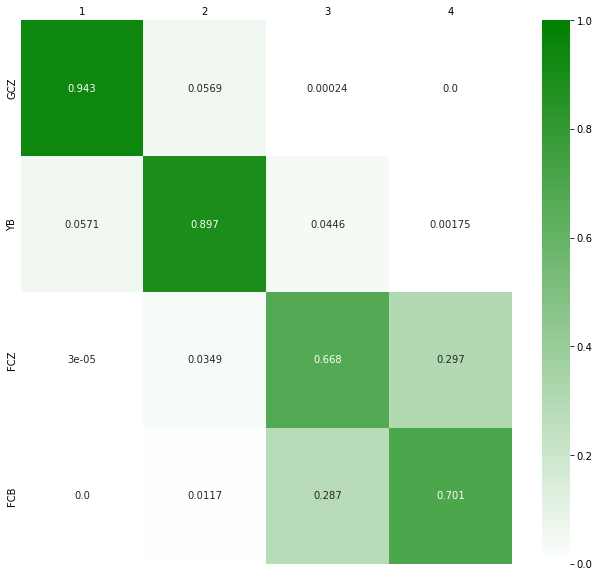
League from schedule without results and current table
Here, we simulate a league from a given schedule. But we do not have any results in the schedule. We only have the current table. This mode assumes that the games are played in order of the schedule. The schedule is a csv file with the following structure:
Home |
Away |
|---|---|
GCZ |
FCZ |
FCB |
YB |
GCZ |
YB |
FCZ |
FCB |
YB |
FCZ |
FCB |
GCZ |
GCZ |
FCB |
FCZ |
YB |
FCB |
FCZ |
YB |
GCZ |
YB |
FCB |
FCZ |
GCZ |
And the table is a csv file with the following structure:
Team |
Played |
GF |
GA |
Points |
|
|---|---|---|---|---|---|
1 |
GCZ |
3 |
6 |
2 |
9 |
2 |
YB |
3 |
5 |
3 |
6 |
3 |
FCB |
3 |
2 |
4 |
1 |
4 |
FCZ |
3 |
1 |
5 |
1 |
The simulation can then be done the following way:
file_sched = "demo_league_sep_schedule.CSV"
file_tab = "demo_league_sep_table.CSV"
teams, schedule, table, missing_games = load.league([file_sched, file_tab])
sim = league.simulate(teams, schedule, table, missing_games, n_sim=1e5)
plot.league(sim)